Water Infrastructure Intelligence · Southern California Hard Tech
A 110-year-old pipe just revealed the hidden infrastructure underwriting problem.
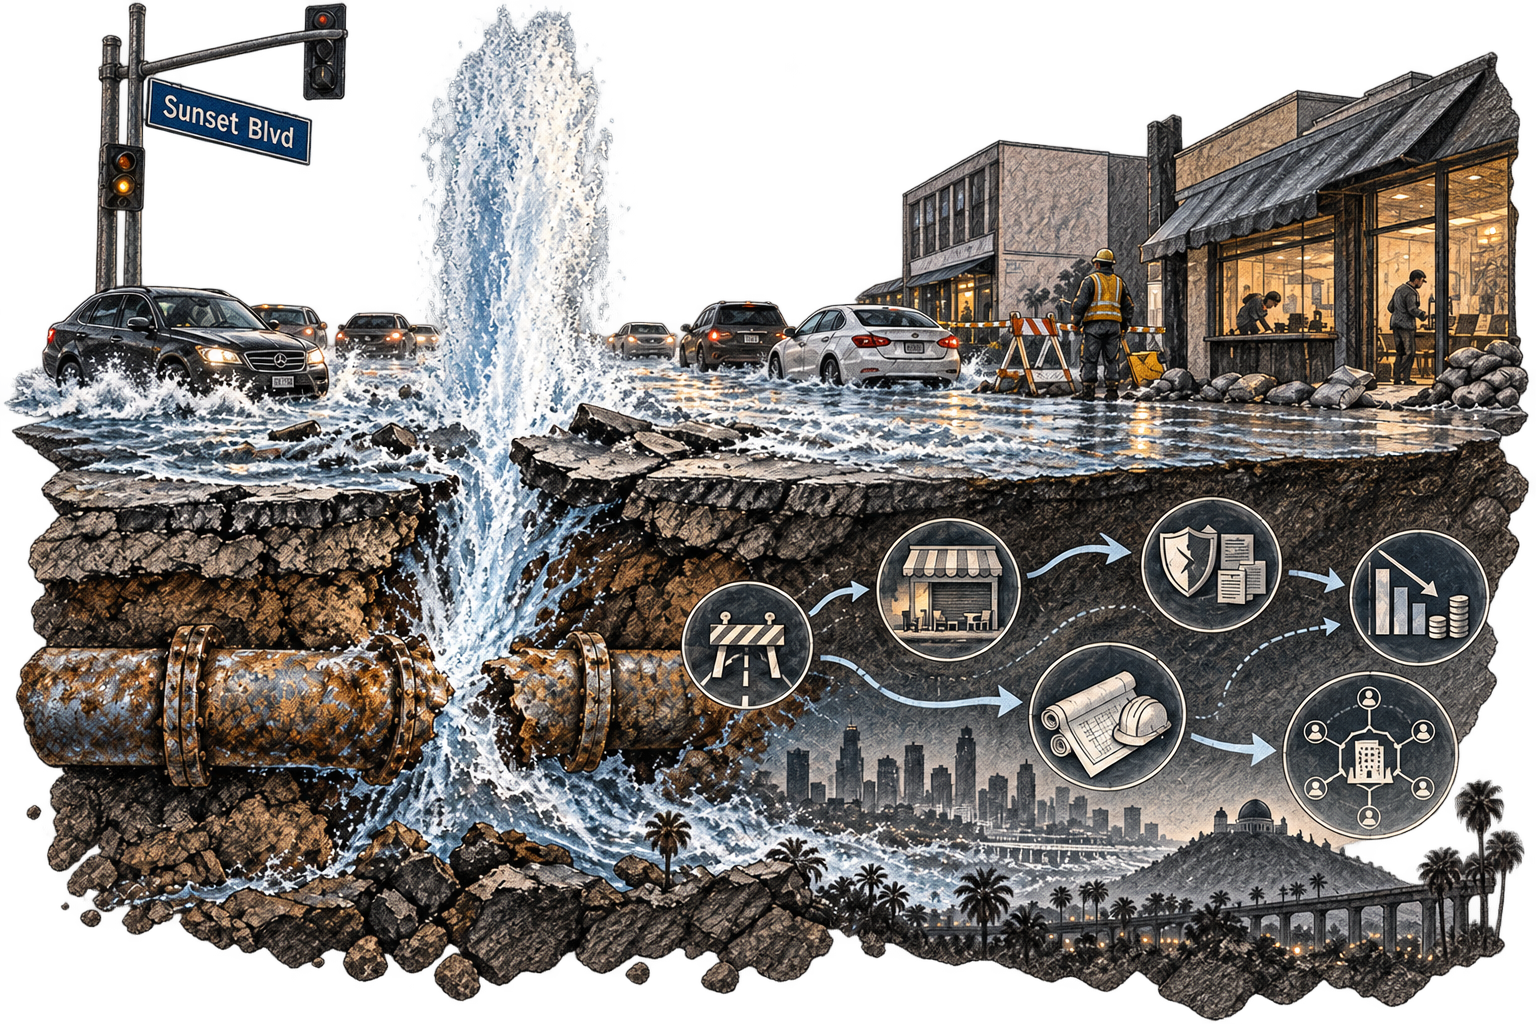
The Sunset Boulevard rupture was not only a flood. It was a live demonstration of how buried public infrastructure can move through access, business interruption, insurance, tenant credit, capital planning and mission continuity.
West Hollywood · July 16–24, 2026 · Mission-Ready Intelligence
Riveted-steel trunk lineInstalled 1916
Transmission line diameterOfficial
Gallons releasedReported estimate
Corridor disruption windowDerived
LADWP mainlines over 80 yearsSystem context
Pipe conditionFlood pathwayWater pressureFire flowAccessTenant recoveryInsuranceCapital
00 · Executive infrastructure command center
One rupture. Eighteen signals. A regional underwriting question.
Filter the operating picture by cluster, public install era, water sensitivity, evidence class and disruption scenario. All proximity outputs remain screening intelligence—not proof of parcel service dependency.
Source-linked incidentCause not publicly establishedCluster geometry = screening13 clusters · 335 sites
The failure travels farther than the water.
Physical failure becomes operational interruption, then cash-flow and mission exposure. Each handoff has a different owner, evidence base and recovery clock.
All SoCal
13 analyst clusters · 335 site records · 8 public pipe-project corridors · 2 comparable rupture events.
72SCREENING
CONFIDENCE
CONFIDENCE
Strong incident and project evidence; limited parcel-level service and hydraulic dependency data.
01 · Geospatial intelligence operating picture
Age evidence beneath hard-tech geography.
Interactive basemaps use public USGS tiles when a network is available. Pipe project lines and cluster points remain schematic evidence overlays. The embedded SVG atlas automatically remains available offline.
Southern California infrastructure × hard-tech atlas
Loading interactive engine
ANALYTICAL MODE
INITIALIZING MAPLIBRE + USGS TILE SERVICES
MAP LAYERS
EXPOSURE
INFRASTRUCTURE
INCIDENT + CONTEXT
WATER SENSITIVITY
LowerHigher
PUBLIC EVIDENCE SCREENING
Approximate corridors and cluster centroids. Not surveyed utility GIS or parcel service proof.
Approximate corridors and cluster centroids. Not surveyed utility GIS or parcel service proof.
ENGINE · SCHEMATICLON — · LAT —ZOOM · REGIONALPORTFOLIO · 13 CLUSTERS
Public install-era evidence
8 projectsCount of publicly documented project corridors by reported install era.
Cluster × exposure matrix
ScreeningComposite of water sensitivity, site concentration and proximity. Click a cell to inspect.
Scenario duration curve
0–100 indexPortfolio interruption score across 4-hour to 30-day assumptions.
Water-sensitive concentration
Top clustersHighest screening sensitivity among the current filtered geography.
Basemaps: USGS The National Map. Interactive rendering: MapLibre GL JS. External tile availability depends on network access; the embedded schematic remains available offline.
02 · Advanced Gantt intelligence
One rupture. Multiple recovery clocks.
Switch from the nine-day incident sequence to the longer capital-replacement horizon. Click any task for its evidence trace.
WORKSTREAMJUL 161718192021222324
Observed response vs. capital horizon
ACTUAL · PLANNED · ACCELERATEDThe emergency repair operated on a nine-day clock; the full replacement program operates on a multi-year capital clock. Acceleration was announced, but a final public schedule was not established in the source set.
Animated incident clock
T+0RUPTURE
Rupture + emergency isolation
03 · Correlated loss transmission
The failure escaped the pipe.
An animated system view of how a municipal asset can transmit loss through private property, operations and capital.
Direct damageFlooding, garages, vehicles, equipment, interiors.
Access denialClosures can interrupt trade without onsite utility loss.
Service degradationRedundant supply may preserve water with lower pressure.
Financial transmissionClaims, rent stress, liquidity and capital reprioritization.
04 · Scenario modeling engine
How the same water event changes by tenant.
This is a transparent qualitative screening model—not an insured-loss forecast. Adjust duration and consequence factors to see which tenant archetypes reach functional interruption first.
Build the event
Duration
Consequences
Scores express relative functional-interruption severity from 0–100. They do not represent probability or dollar loss.
61Portfolio interruption index
7 daysModeled duration
4Archetypes ≥75
ScreenEvidence class
Direct flooding plus a seven-day access disruption
moves the largest burden toward clean processes, laboratories, special processes and
high-requalification operations.
05 · Hard-tech cluster ledger
Which clusters sit near documented aged-pipe projects?
Distance is calculated from approximate analyst cluster centroids to schematic public project corridors. It is a research-priority signal, not proof of water-service dependency.
| Cluster | Sites | Company presence | Water sensitivity | Archetype signal | Nearest public aged-pipe project | Screening distance | Evidence class |
|---|---|---|---|---|---|---|---|
| CL-12South Bay aerospace, space and precision industry | 64 | 61 | Very high | Aerospace · space · precision production | Western Trunk Line | ~3.8 mi | A · ≤15 mi |
| CL-06Irvine–South OC semiconductors and medical hardware | 59 | 55 | Very high | Semiconductor · medical · clean process | Western Trunk Line | ~35.7 mi | C · >30 mi |
| CL-04Coastal and West OC aerospace and energy | 43 | 39 | High | Aerospace · energy · composites | Western Trunk Line | ~24.8 mi | B · 15–30 mi |
| CL-09San Fernando Valley precision manufacturing | 38 | 35 | Elevated | Machining · aerospace production | Roscoe Trunk Line Units 1–2 | ~2.0 mi | A · ≤15 mi |
| CL-08North OC electronics and precision industry | 35 | 30 | High | Electronics · precision production | Western Trunk Line | ~22.3 mi | B · 15–30 mi |
| CL-13Southeast LA manufacturing and materials | 23 | 21 | High | Materials · special process · fabrication | Western Trunk Line | ~13.7 mi | A · ≤15 mi |
| CL-10San Gabriel Valley optics, materials and manufacturing | 20 | 20 | High | Optics · materials · precision process | Western Trunk Line | ~19.1 mi | B · 15–30 mi |
| CL-11Santa Clarita aerospace and industrial systems | 15 | 15 | Elevated | Aerospace · industrial systems | Foothill Trunk Line Unit 3 | ~11.0 mi | A · ≤15 mi |
| CL-07Long Beach aerospace, space and mobility | 13 | 11 | High | Space · aerospace · mobility | Western Trunk Line | ~13.1 mi | A · ≤15 mi |
| CL-02Burbank–Pasadena aerospace and research corridor | 11 | 11 | Elevated | R&D · aerospace · instruments | Sunset Trunk Line incident corridor | ~11.4 mi | A · ≤15 mi |
| CL-05Industry–Pomona industrial electronics | 8 | 8 | Elevated | Industrial electronics · manufacturing | Western Trunk Line | ~23.8 mi | B · 15–30 mi |
| CL-03Central and West LA emerging hard tech | 5 | 5 | Moderate | R&D · software-enabled hardware | Sunset Trunk Line incident corridor | ~3.1 mi | A · ≤15 mi |
| CL-01Antelope Valley advanced aviation | 1 | 1 | Moderate | Flight test · aerospace systems | Foothill Trunk Line Unit 3 | ~26.5 mi | B · 15–30 mi |
06 · Evidence room
Every headline number has a trace.
Observed facts, reported estimates, derived durations, screening calculations and unknowns are deliberately distinguished.
LADWP · Initial Response
July 16 response, low-pressure warning, 8-inch alternate pipe, 0.7-mile isolated section and claims.
Open evidence ↗Los Angeles Times · Event Reconstruction
1916 pipe, 17 million gallons, trunk-line system context and business/property impacts.
Open evidence ↗LADWP · July 19 Update
36-inch 1916 trunk line and prioritization factors including leak history, soil and age.
Open evidence ↗City of West Hollywood · Reopening
Sunset Boulevard reopened at approximately 11 p.m. July 24.
Open evidence ↗LADWP · Pipe Replacement
25-foot segment, welding sequence, 6.4-mile replacement program and leak-rate / replacement metrics.
Open evidence ↗LADWP · Slurry Backfill
300 cubic yards / 30 truckloads and 24-hour cure.
Open evidence ↗LADWP · Alternate Restoration Plan
Recurring leaks, temporary isolation, 60% design, accelerated replacement and four-year project estimate.
Open evidence ↗LADWP · Sunset West Trunk Line
1930s trunk-line replacement near Stone Canyon / Sunset.
Open evidence ↗LADWP · Western Trunk Line
Four miles of pipe installed 1916–1947 being replaced with earthquake-resistant pipe.
Open evidence ↗LADWP · Roscoe Trunk Line
1917 line, recent leaks, top-20% risk ranking and 2025–2033 replacement.
Open evidence ↗LADWP · De Soto Trunk Line
102-year-old trunk line and planned four-mile replacement.
Open evidence ↗LADWP · Foothill Trunk Line Unit 3
1930s pipe and three-mile earthquake-resilient replacement.
Open evidence ↗LADWP · Hazeltine Mainline
1926–1947 mainline and earthquake-resistant replacement.
Open evidence ↗LADWP · City Trunk Line North
Six-plus miles of aged pipeline replacement and system-flexibility investment.
Open evidence ↗NBC Los Angeles · Cause Status
Cause under investigation, flooding, closures and transit impacts.
Open evidence ↗LADWP · Resiliency & Reliability
7,340 miles, 16.1 leaks per 100 miles and infrastructure renewal context.
Open evidence ↗LADWP · Mainline Age Context
6,794 mainline miles and approximately 30% over 80 years old.
Open evidence ↗UCLA · Facility Recovery
Pauley Pavilion and Collins Court reopening after 2014 flood.
Open evidence ↗UCLA · 2014 Event
30-inch, 93-year-old steel pipe and campus impact.
Open evidence ↗UCLA · Vehicle Recovery
Nearly 1,000 vehicles removed from flooded structures.
Open evidence ↗Attached Hard-Tech Landscape Workbook
288 operating businesses, 335 site records and 13 analyst-defined clusters.
Open evidence ↗
Geospatial technology and basemaps. Interactive rendering uses MapLibre GL JS 5.13.0.
Raster basemaps are requested from USGS The National Map services: USGS Topo, Imagery Only, Imagery Topo,
Shaded Relief and Hydrography. The map automatically retains an embedded schematic fallback when those
network resources are unavailable.
Mission-Ready Intelligence · Infrastructure Investigation
A 110-Year-Old Pipe Just Revealed the Hidden Infrastructure Underwriting Problem.
The Sunset Boulevard rupture was not only a flood. It was a live demonstration of how buried public infrastructure can reach into property operations, access, insurance, tenant credit, capital planning and mission continuity—without failing inside the parcel.
The street flooded before most of the city was awake.
Before dawn on , a large water transmission line ruptured beneath Sunset Boulevard in West Hollywood. The failed asset was a riveted-steel trunk line installed in .
Water raced downhill through streets, underground garages, businesses and a Metro bus yard. The release was estimated at approximately . A sinkhole opened in one of Southern California’s most recognizable commercial corridors. Vehicles were damaged. Businesses closed. Road and transit patterns changed in a matter of hours.
The rupture happened under one street. The loss traveled through an entire neighborhood system.
The initial failure was municipal. The consequences were private: damaged property, interrupted customers, inaccessible businesses, compromised electrical equipment in flooded garages, claims, temporary housing and a corridor whose economic function could not return until excavation, pipe work, testing and road reconstruction were complete.
A short pipe repair became an eight-day operating event.
LADWP was notified and isolated a . But stopping the uncontrolled flow did not reopen Sunset Boulevard. Crews still had to drain the system, shore the excavation, cut out a , install steel, weld, repressurize, test, disinfect, verify water quality, backfill and repave.
The physical weld itself could take up to . The corridor remained disrupted for approximately , with reopening reported around 11 p.m. July 24.
That difference—between valve closure and commercial recovery—is the infrastructure equivalent of the gap between building repair and production recovery. One clock measures the asset. Another measures the economy around it.
25 FTPipe section replaced
300 CYConcrete slurry backfill
~8 DAYSCorridor disruption window
The pipe was old. That does not prove why it failed.
The exact cause remained in the contemporaneous sources reviewed. The line’s age is indisputable. Its material is known. The surrounding operating environment can be studied. But a forensic conclusion requires more than a birth year.
LADWP says trunk-line prioritization considers . A serious underwriting model would add material, joint type, internal and external corrosion, pressure cycles, ground movement, repair history, condition-assessment results, isolation geometry, redundancy and consequence of failure.
“Old” is a warning label. It is not a complete failure model.
This matters because a simplistic age overlay can mislead in both directions. It can overstate the risk of an old but well-managed segment—and understate the risk of a younger pipe exposed to adverse soil, pressure, installation or joint conditions.
A generally reliable network can still produce a catastrophic local outlier.
LADWP reports approximately of mainlines and trunk lines. Its distribution network includes about , of which roughly .
At the same time, the utility reports an FY 2024–25 rate of —36% below the cited national industry average. It also reported replacing more than of pipeline in 2024–25.
Those statistics are not contradictory. They reveal the underwriting problem. Frequency can look acceptable at portfolio scale while the severity of one large-diameter failure remains extreme. An investor who sees only the average leak rate misses tail consequence. An investor who sees only the 110-year age misses system performance and active replacement.
THE UNDERWRITING TENSION
Low average frequency does not eliminate high-consequence nodes.
Portfolio reliability, segment condition, redundancy and consequence must be analyzed together.
The first repair plan did not survive repressurization.
After the replacement segment was installed, crews began the sequence of testing and restoration. A pinhole leak required repair. Then another leak appeared in an existing portion of the pipe during testing. LADWP shifted to an alternate plan: isolate the affected trunk-line section and maintain local service through the .
The episode shows why “estimated repair time” should be modeled as a distribution rather than a fixed date. Repressurization can expose additional weaknesses. Water-quality approvals, curing and civil restoration add dependencies. Crews placed —about 30 truckloads—before a 24-hour cure and paving.
For a property or tenant, the uncertainty around restoration can be as important as the initial outage. Decisions about reopening, customer communication, inventory, temporary operations and claims all depend on a schedule that can move when new defects appear.
The replacement was already planned. Construction was still years away.
The broader Sunset trunk-line replacement was expected to begin in . After the rupture, LADWP said the project was and would be accelerated. Even then, the full replacement was described as a complex project expected to take about .
This is the hidden capital problem under mature cities. Identifying an aging asset does not instantly remove the risk. Design, environmental review, permits, traffic planning, procurement, construction staging and community coordination can span longer than a lease negotiation, loan term or tenant expansion cycle.
Infrastructure risk can be known, funded and designed—and still remain physically in the ground.
The 2026 rupture was not Sunset Boulevard’s first warning.
In July 2014, a 30-inch steel pipe near UCLA ruptured. UCLA described the asset as . The eventual water-loss estimate reached about . Parking structures, fields, athletic facilities and Pauley Pavilion were flooded.
Crews ultimately dealt with nearly in affected parking structures. Sunset Boulevard reopened in six days, but major facilities including Pauley Pavilion did not reopen until October—roughly .
The comparison is important because it reveals multiple recovery clocks. The street can reopen. Water can be restored. The facility, contents, specialized floor systems and operations can remain impaired long afterward.
The most important utility asset may not appear in the property report.
Conventional property diligence focuses on what the owner controls: roof, structure, electrical service, fire protection, environmental history, zoning and tenancy. The rupture demonstrates a different category of exposure—critical infrastructure owned and operated by someone else.
A buried public line can create direct flooding, deny access, reduce water pressure, affect fire-response capability, reroute transit, close a commercial corridor and trigger claims. The tenant may suffer loss even when the failure point is outside the insured premises. The landlord may face rent stress without structural damage. The lender may see weakened cash flow even though its collateral remains standing.
The proper unit of analysis is therefore not the parcel alone. It is the parcel plus the external utility and access systems required for the tenant’s operation.
PIPE→FLOOD / PRESSURE→ACCESS→TENANT OPERATIONS→NOI / CREDIT→MISSION
The public data can show proximity. It cannot yet prove dependency.
The attached landscape identifies containing . The largest grouping—South Bay aerospace, space and precision industry—contains .
Public LADWP project pages reveal specific aged corridors, including the and a Western Trunk Line segment installed between . Those records can be mapped against industrial clusters as a screening exercise.
But proximity is not proof that a company is served by a particular pipe. Cluster boundaries are analytical city groupings. Utility service can vary parcel by parcel. Exact dependency requires service maps, hydraulic zones, connection records, redundancy, fire-flow data and field verification.
The age layer is useful only when its limits are visible.
Different hard-tech tenants turn the same outage into different losses.
A four-hour disruption may be manageable for general assembly but material for a continuous thermal process. A 24-hour outage can threaten environmental controls, cooling, process water and work in process. A seven-day corridor closure can become a workforce, logistics and customer-access event even where water service continues.
Semiconductor, cleanroom, medical-device and laboratory operations can face contamination and requalification burdens. Plating, heat treatment and materials processes can depend on water, wastewater and fire protection. Precision machining may use less process water but still depends on cooling, fire flow, employee access and supplier continuity. Data and compute facilities may have low direct process-water intensity at some sites and high cooling dependence at others.
The correct model therefore combines outage duration, direct flood footprint, pressure loss, access denial, fire-flow impairment, contamination sensitivity and restart complexity.
A single break is local. A regional earthquake can make many breaks correlated.
The July rupture was a single-node event with extensive emergency resources available. Earthquake scenarios are different. Ground deformation can damage multiple buried lines while roads, power, communications and response capacity are also impaired.
The hard-tech consequence is not simply “no water.” It can be reduced pressure, impaired suppression, inaccessible facilities, cooling loss, wastewater constraints and delayed restart across several industrial clusters at once. Fire-following-earthquake risk is especially sensitive to whether water pressure and access remain available when ignition demand is highest.
This is where infrastructure underwriting becomes catastrophe accumulation: separate properties can share one water system, one repair workforce and one emergency-response environment.
Two identical buildings may not carry identical infrastructure risk.
One property may have a newer, looped utility environment with multiple practical access routes and onsite process-water or fire-water capacity. Another may depend on a high-consequence legacy corridor with limited redundancy. The buildings can look identical in a rent survey while their operational resilience differs materially.
That does not automatically justify a cap-rate adjustment. The evidence must be specific: service dependency, condition, consequence, redundancy, tenant sensitivity, insurance structure and modeled downtime. But the logic is clear. If infrastructure resilience changes expected downtime and cash-flow volatility, it can ultimately influence rent, insurance, reserves, loan structure and value.
Mission-Ready underwriting should therefore ask not only whether water reaches the meter—but what happens after the pipe feeding the district fails.
The new utility diligence stack.
Owners should identify operator, pressure zone, service path, known capital projects, flood pathways and fire-flow dependence. Tenants should quantify process-water, cooling, sanitation, wastewater, fire protection and restart requirements. Lenders should test cash flow against multi-day off-premises utility and access interruption. Insurers should examine service-interruption, ingress/egress, civil-authority, water-damage and contingent-BI language on a policy-specific basis.
Municipalities and utilities can make the market more intelligent by publishing segment vintage, material, condition classes, break history, replacement schedules and resilience projects in usable geospatial formats—while protecting security-sensitive details.
The decisive question is not “How old is the pipe?” It is: what fails, who depends on it, what redundancy exists, and how long until operations recover?
14 · CONCLUSION
The pipe broke beneath Sunset Boulevard. The underwriting failure was believing the property line contained the risk.
A 110-year-old asset transformed a utility incident into flooding, access loss, transit disruption, claims and business interruption. The lesson for Southern California hard tech is larger: buried public infrastructure is part of the operating system of every factory, laboratory and technical campus—even when it never appears on the rent roll, appraisal or structural report.
Mission-Ready · Water infrastructure intelligence
Put off-parcel water risk into the property decision.
Email Carl for tailored water-infrastructure intelligence connecting exact properties and tenant operations to operator context, pressure and service pathways where verifiable, known capital projects, flood and access exposure, fire-flow dependency, outage and restart sensitivity, insurance questions, and decision-ready diligence.
- Property + service context
- Tenant process sensitivity
- Flood + access pathways
- Fire flow + redundancy
- Capital + insurance questions
See what sits outside the property report.Email
Carl for Water Intelligence
Scope can focus on one property, a portfolio, a tenant archetype, a regional cluster or an active transaction.